
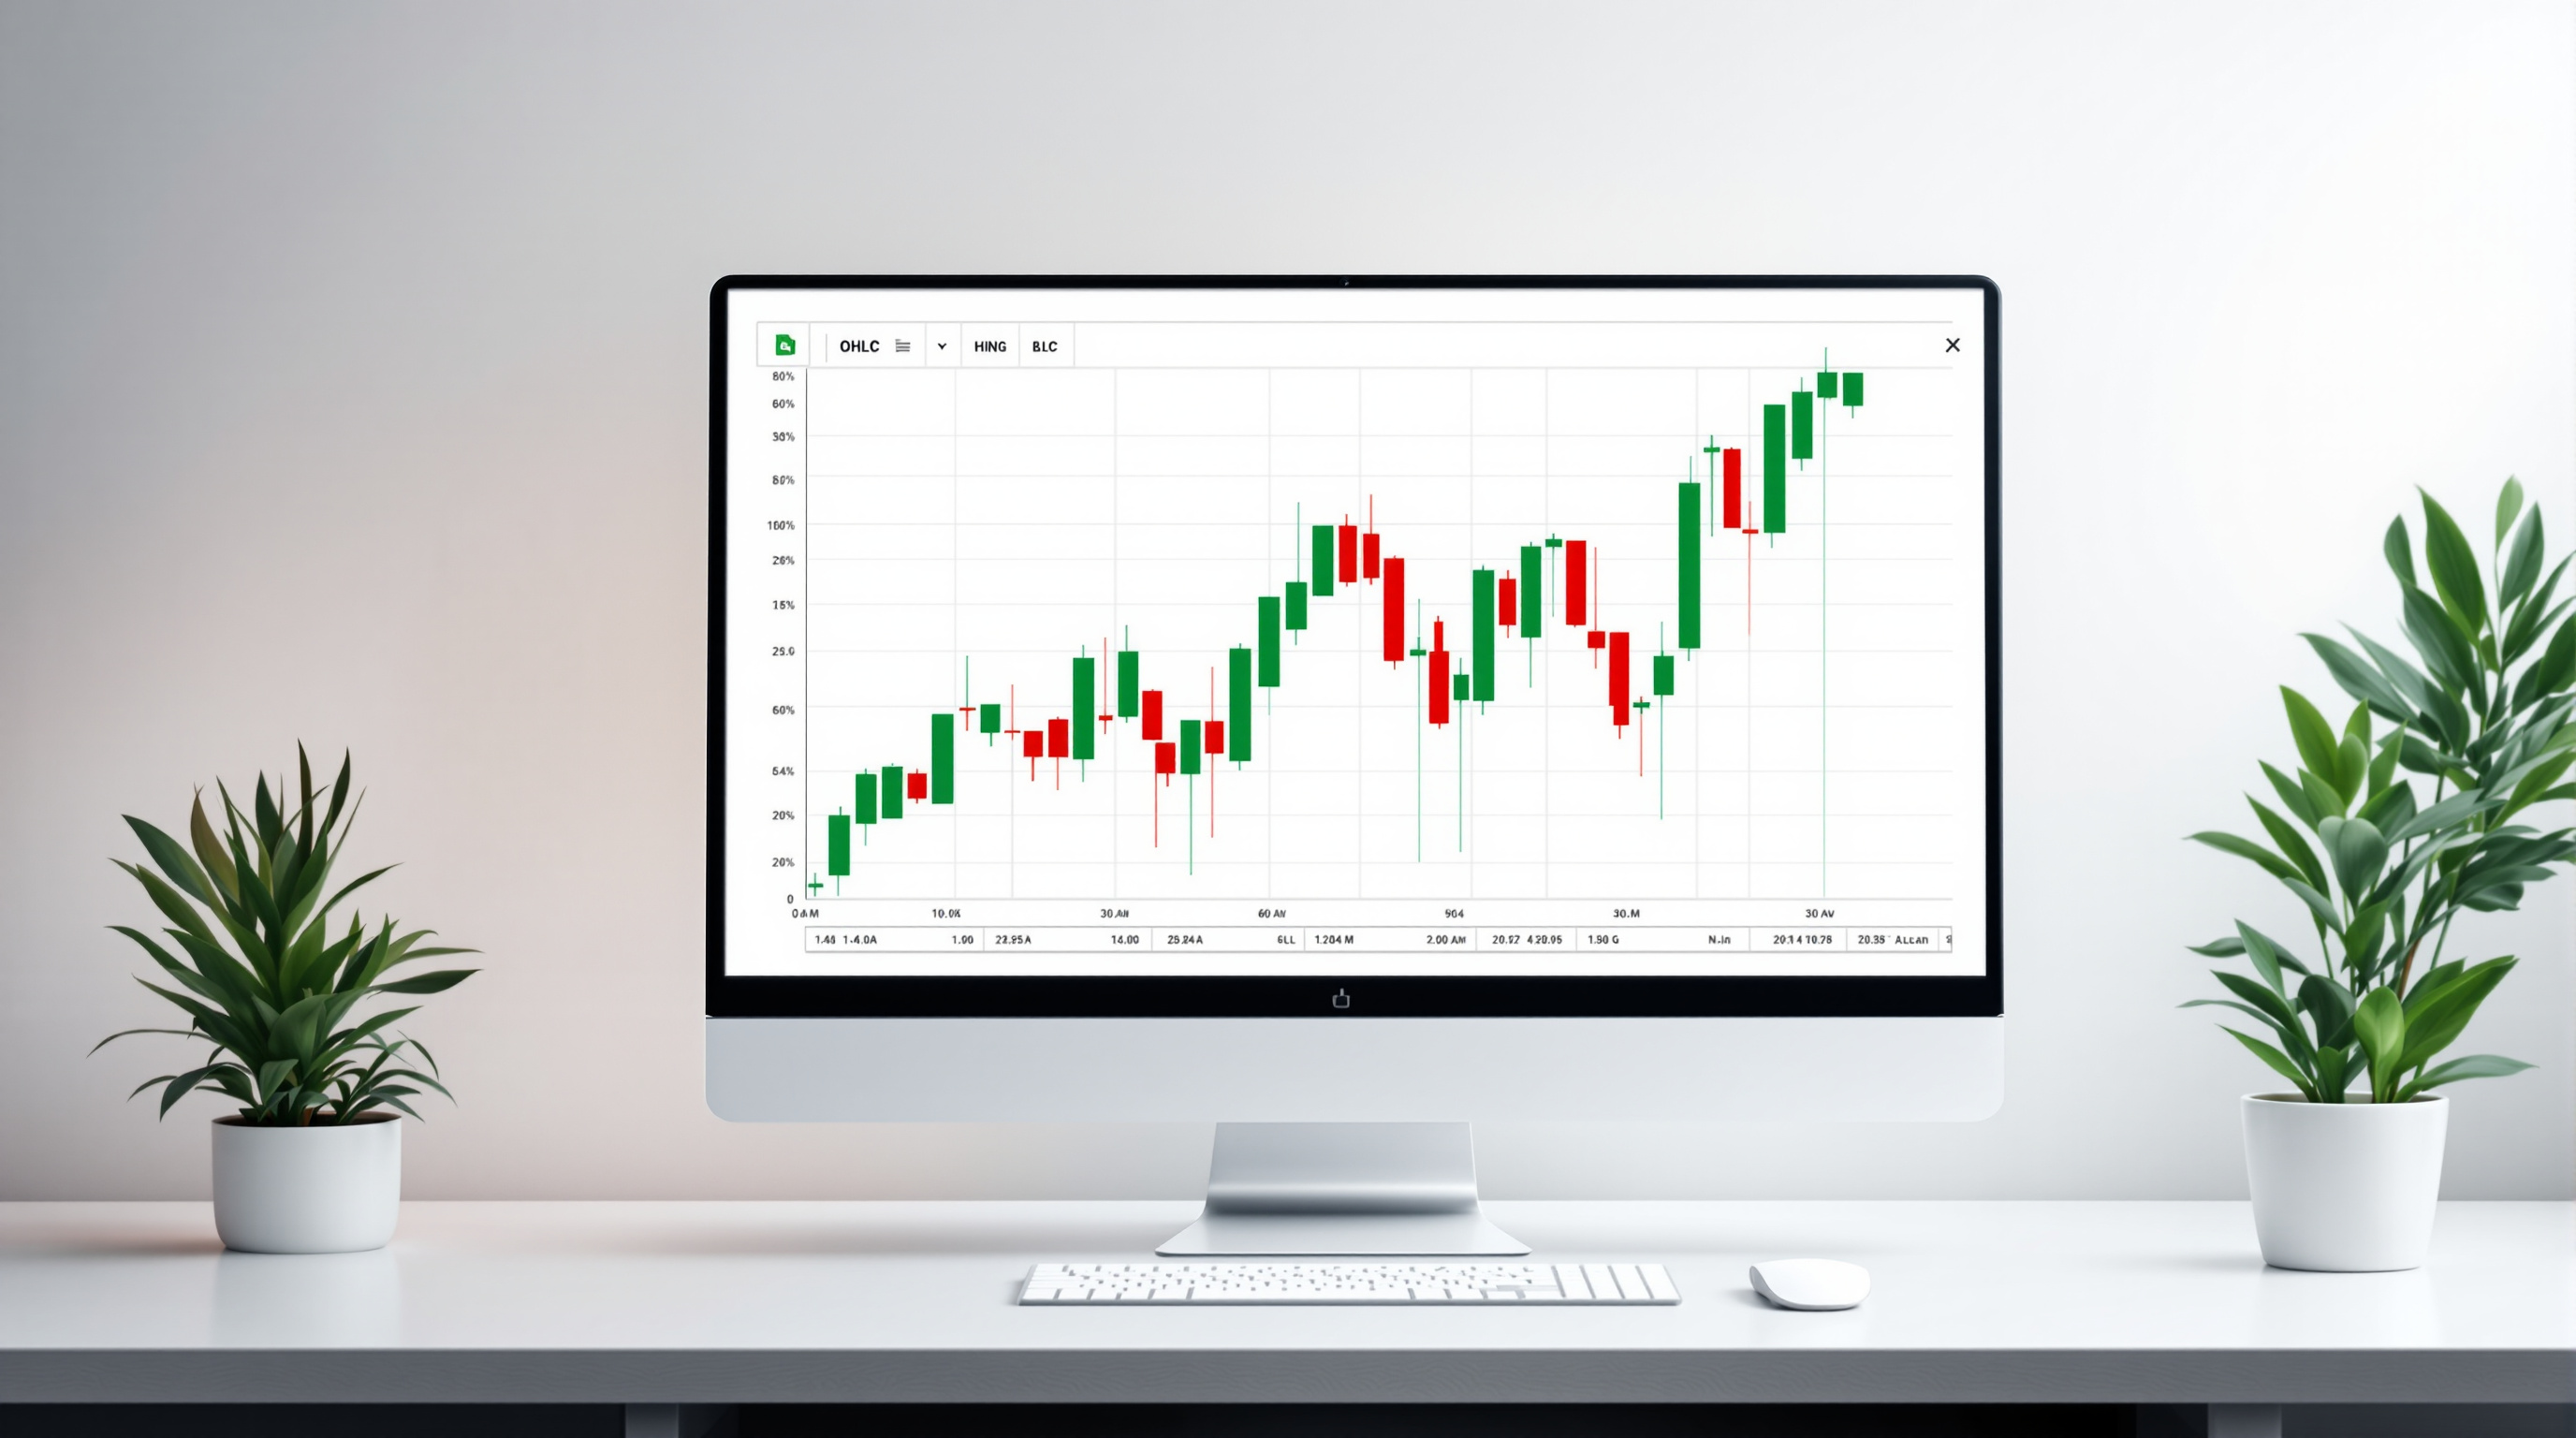
Google Sheets now lets you build proper stock charts—High-Low-Close (HLC) and Open-High-Low-Close (OHLC)—directly in your spreadsheet. If you're tracking equities, commodities, or any time-series price data, you can finally see the full trading range for each period in a single marker instead of juggling multiple line series. And if your team moves files between Excel and Sheets, these charts now import cleanly rather than disappearing entirely.
Why does this matter for financial analysis?
Anyone who's built a valuation model or tracked portfolio performance in a spreadsheet knows the frustration: you've got opening prices, highs, lows, and closing prices, but visualising them together meant either clunky workarounds or switching to dedicated charting software.
Stock charts solve this by condensing all those data points into one visual marker per time period. At a glance, you can see:
- The full trading range (high to low)
- Where the period opened and closed
- Whether the session ended up or down
That's genuinely useful when you're presenting to stakeholders or making quick decisions about positions.
What's the difference between HLC and OHLC charts?
| Chart Type | Data Points Shown | Best For |
|---|---|---|
| High-Low-Close (HLC) | Highest price, lowest price, closing price | Quick view of range and settlement |
| Open-High-Low-Close (OHLC) | Opening price, highest, lowest, closing | Full session context, spotting gaps |
OHLC gives you more information—you can immediately tell if a stock opened low and rallied or opened high and sold off. HLC is simpler when you only need the range and close.
How do you create a stock chart in Google Sheets?
- Organise your data in columns: Date, Open, High, Low, Close (for OHLC) or Date, High, Low, Close (for HLC)
- Select your data range
- Go to Insert > Chart
- In the Chart editor, choose either "High-Low-Close chart" or "Open-High-Low-Close chart" from the chart type menu
- Customise colours, axis labels, and titles as needed
The chart updates automatically when your underlying data changes—handy if you're pulling live prices via add-ons or linked data.
What about files coming from Excel?
This is where things get practical. Previously, if a colleague sent you an Excel workbook with stock charts, Sheets would simply drop them during import. You'd have to rebuild everything manually.
Now, HLC and OHLC charts import intact. If your organisation uses both platforms—or you're collaborating with external partners who prefer Excel—you won't lose work moving files back and forth.
For teams already using Google Workspace for collaboration, this removes one more friction point when working with external data.
Frequently asked questions
Do I need a specific Google Workspace plan for stock charts?
No. This feature is available to all Google Workspace customers and even personal Google account users.
Can I use stock charts for non-financial data?
Technically yes—any data with high, low, open, and close values per period works. Some teams use similar formats for inventory levels or temperature ranges, though the visual style is optimised for price data.
Will my existing Excel stock charts convert automatically?
Yes. When you import an Excel file containing HLC or OHLC charts into Sheets, they're preserved. No manual rebuilding required.
Ready to get your team on Google Workspace?
If you're not yet using Google Workspace—or you're on an older setup that could use a refresh—Blue Chip Technologies Ltd. can help with licencing, migration, and ongoing support. We work with businesses worldwide, handling everything remotely, with on-site assistance available for clients in Trinidad & Tobago.
Get in touch:
- Contact us online
- Call: 1 (868) 609-2288
- Email: [email protected]